How to interpret Measurements
The Oaklean VS Code Extension provides insights into the resource consumption of your NodeJS/TypeScript application. In the following sections, we will explain how to interpret the measurements related to resource consumption.
⚠️ We use "Sensor Values" and "Measurements" synonymously.
Execution Scopes
To better understand where high resource usage originates, we categorize the measurements as follows:
- own code: Code of the project being measured.
- libraries: Code of a Node module that is imported and used in the project being measured.
- node internal: Code of the programming language itself or standard libraries integrated into the Node runtime environment.
Sensor Value Types
To interpret sensor values, we should look at their naming conventions. Except for the value profilerHits, each sensor value follows this naming convention:
<type-of-resource> (<category>)
profilerHits: In addition to resource consumption values, there is a measurement value called profilerHits. This does not describe a resource used by the application but rather how often the CPU profiler, used to measure CPU time, detected a certain source code location.
Categories
There are currently five categories:
- self: Indicates how much resource consumption originates from the source code location itself.
- own code: Indicates how much resource consumption originates from the invocation of functions of your code.
- libraries: Indicates how much resource consumption originates from the invocation of library functions.
- node internal: Indicates how much resource consumption originates from the invocation of node internal functions.
- summed up: Includes all the above categories.
Types of Resources
Currently, three types of resources are measured:
- CPU Time
- CPU Energy Consumption
- RAM Energy Consumption
Example
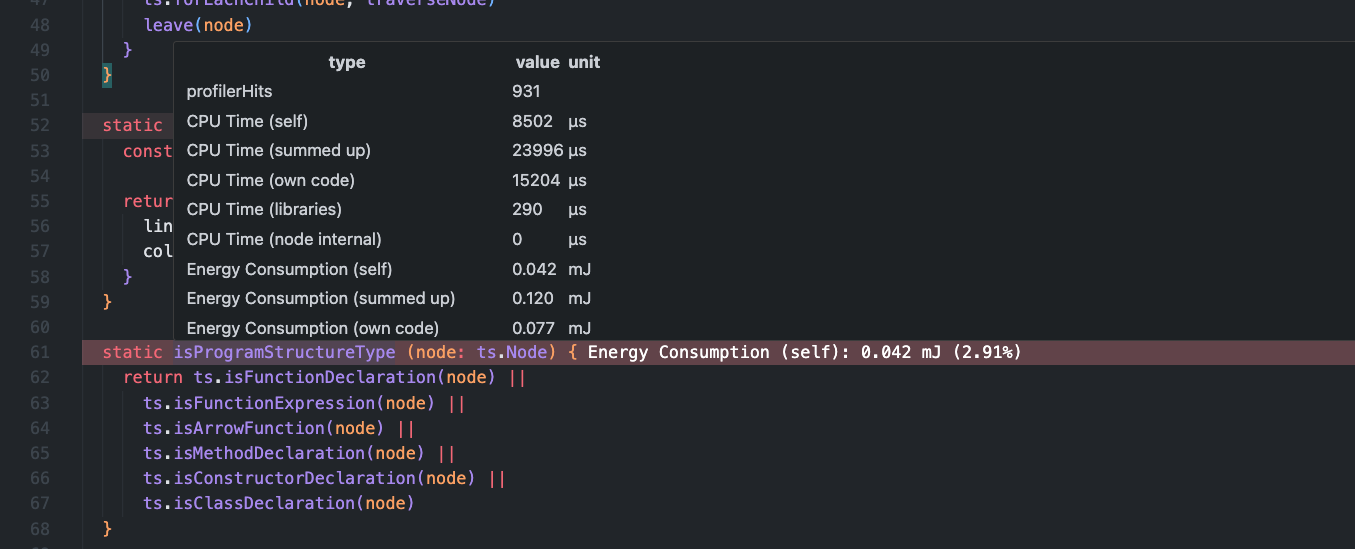
Sensor values are stored at specific source code locations. In the example below, we interpret the sensor values of the method isProgramStructureType.
Given the example above, the measurements describe the following:
| Sensor Value Type | Description |
|---|---|
| CPU Energy Consumption (self) | How much CPU energy was consumed by the method isProgramStructureType itself. |
| CPUEnergyConsumption (own code) | How much CPU energy was consumed by methods of your code that were directly or indirectly called by the method isProgramStructureType. |
| CPU Energy Consumption (libraries) | How much CPU energy was consumed by library methods that were directly or indirectly called by the method isProgramStructureType. |
| CPUEnergyConsumption (node internal) | How much CPU energy was consumed by node internal methods that were directly or indirectly called by the method isProgramStructureType. |
| CPU Energy Consumption (summed up) | How much CPU energy was consumed in total; this is the sum of all the values above. |
Custom Formula
Users can create a custom representation of the measurement data with a mathematically valid formula. The formula may only contain mathematical symbols, names of the measurement data, and numbers.
Below is a list of all available variable names of the measurement data. The naming convention is:
<prefix><type-of-resource>
Prefixes
Prefixes are directly correspondent to the categories listed above
- self = self
- intern = own code
- extern = libraries
- langInternal = node internal
- aggregated = summed up
All available variable names of the measurement data are:
| Variable Name | Unit |
|---|---|
| profilerHits | |
| selfCPUTime | µs |
| aggregatedCPUTime | µs |
| internCPUTime | µs |
| externCPUTime | µs |
| langInternalCPUTime | µs |
| selfCPUEnergyConsumption | mJ |
| aggregatedCPUEnergyConsumption | mJ |
| internCPUEnergyConsumption | mJ |
| externCPUEnergyConsumption | mJ |
| langInternalCPUEnergyConsumption | mJ |
| selfRAMEnergyConsumption | mJ |
| aggregatedRAMEnergyConsumption | mJ |
| internRAMEnergyConsumption | mJ |
| externRAMEnergyConsumption | mJ |
| langInternalRAMEnergyConsumption | mJ |
Example Formulas
- A formula to establish the relationship between CPU energy consumption and CPU time:
selfCPUEnergyConsumption/selfCPUTime - A formula to detect the functions/methods with the highest proportionate library energy consumption:
externCPUEnergyConsumption/aggregatedCPUEnergyConsumption